
Monitoring warm-up, energy and injection moulding machines in one system
Injection moulding machines consume large amounts of energy during warm-up and operation. More than 50 machines are connected to an on-site ITS Server which, together with SCADA and machine-side HMI panels, forms one system for collecting and presenting data. The system monitors heating, power at the main supplies, auxiliary utilities and factory conditions, and notifies the relevant teams.
Wirthwein Polska — injection moulding in Łódź
Wirthwein Polska Sp. z o.o. is part of Germany’s Wirthwein Group, headquartered in Creglingen, a manufacturer of plastic components. The Łódź plant produces injection-moulded parts and is the group’s largest factory.
production plant in the Widzew district
production of plastic components by injection moulding
customer sectors: household appliances, automotive, electrical, energy and sanitary fittings
Wirthwein Group — factories in Europe, Asia and the USA
A heated machine that never entered production
An injection moulding machine consumes energy while heating up and preparing for production, even if production never starts. Machines sometimes remained in this state — and this needed to be detected.
No available staff
The machine is switched on for heating, but nobody starts production.
Production changes
The production plan changes after heating has started.
Human error
The machine is switched on and is not switched off after preparation.
Consequence
Heating continues beyond the specified warm-up period — recorded as excess heating time.
Additional challenges include start-up power peaks on the main incoming supplies and auxiliary utilities — compressed air and chilled water for mould cooling — whose operation affects cost and quality.
On-site ITS Server: data sources, processing and users
Data from injection moulding machines, main power supplies, compressed air, chilled water and the LoRaWAN network flows into one ITS Server, then to SCADA, HMI panels, teams and analytics.
On a small screen, scroll the diagram sideways to see the whole layout.
ITS Server
An on-site instance serving over 50 machines: periodic data, threshold monitoring, low-code automation, LoRaWAN Network Server and a dashboard module.
Traceability module
Logs team assistance calls and machine, quality, cleanliness and process-fluid inspections in the history.
Pro-face HMI panels
Additional touch panels next to the machines, serving the entire system independently of each machine’s own operator panel.
The figure of over 50 machines refers to this installation. More machines can be added without changing the architecture.
Eight functions — from source to outcome
Each row shows where the data comes from, how ITS Server processes it and the outcome for the plant.
When the heating threshold is exceeded without production starting, ITS Server initiates a shutdown signal to the machine controller. Operating, heating and excess heating time data supports daily and weekly management meetings. Combined with machine operating times, it also helps locate compressed-air leaks in selected sections of the installation. Historical temperatures before and after the mould support fault and leak analysis in the chilled-water system.
On a small screen, scroll the diagram sideways to see the whole layout.
One system instead of several separate tools
ITS Server, SCADA and HMI panels provide a shared view of plant operation — from energy to machine inspections.
injection moulding machines connected to one on-site ITS Server
functions in one system — from warm-up control to inspection logging
teams notified by SMS from the machine-side panel: Maintenance, Quality, Setters and Logistics
types of data sources: moulding machines, power supplies, compressed air, chilled water and LoRaWAN
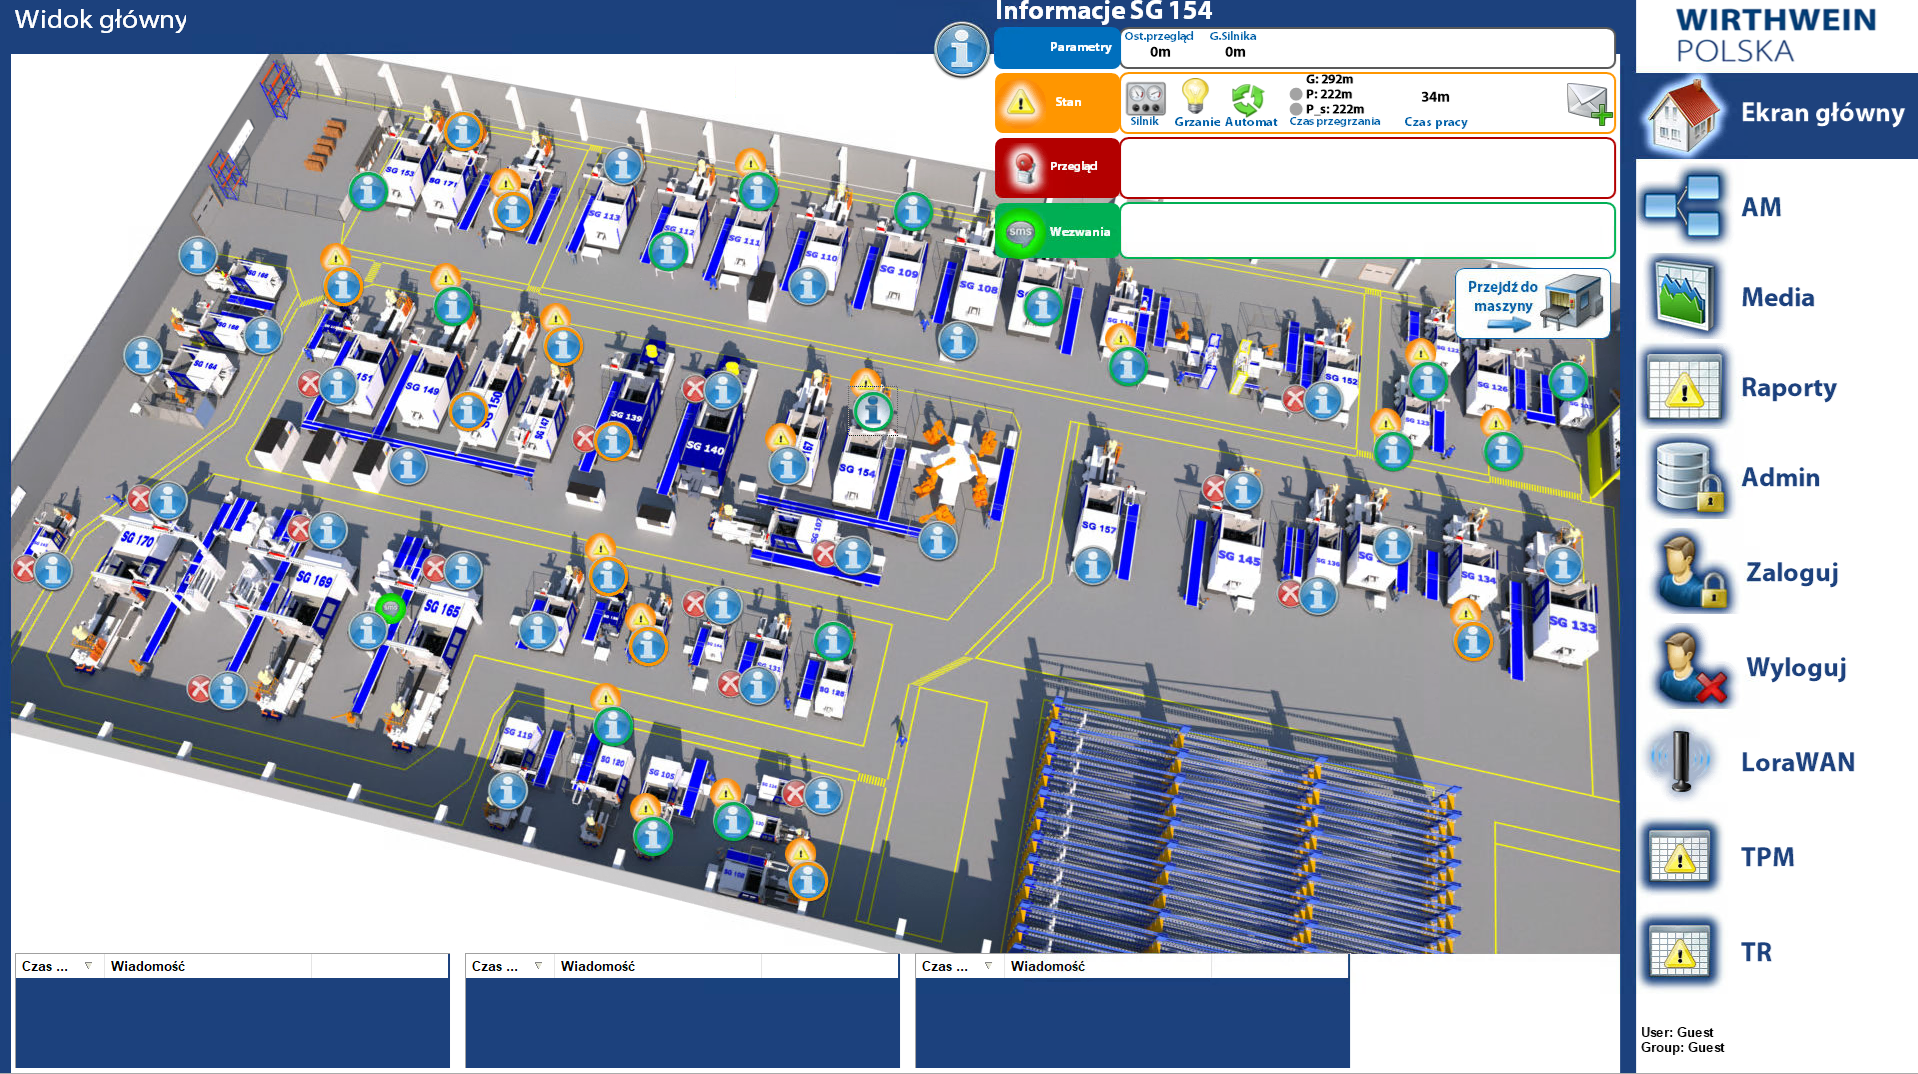
ITS system dashboards
Operating data from the deployed system: machine activity, energy consumption and cooling-system parameters. The original screenshots retain the Polish interface.
ITS is the starting point, not the endpoint
Data collected by ITS Server does not remain confined to one system. The platform forwards it to tools already used at the plant or elsewhere in the company.
On a small screen, scroll the diagram sideways to see the whole layout.
The systems shown are examples — ITS also integrates with other third-party systems, tailored to the client’s specific IT environment.
Would you like to monitor heating, energy and utilities at your production plant?
Let’s discuss the machines and utilities at your plant and how to collect their data in one ITS Server.
Tell us about your plant.
Include the number of machines, available signals and the data you need.